
Your CRM is the foundation for a better sales process, more productive conversations, and higher revenue. But, what if it isn’t? Enter: The top CRM KPIs you should be tracking across your sales team today.
Customer relationship management is a tricky business, and you need to make sure your process, pipeline, and people are working properly in order to get the results you expect.
How can you make sure things are running smoothly, or fix cracks in your process before they become major issues?
Simply put, you need to be tracking the right customer relationship management KPIs.
What Are CRM KPIs (Key Performance Indicators)?
CRM KPIs are the key performance indicators that you track within your CRM software, and give you the insights you need to manage customer relationships. These help you align business decisions with customer needs, and track sales performance metrics to make sure your team is reaching their full potential.
So, which of these essential sales metrics should you be tracking? Well, that all depends on your role in the sales team.
That’s why we’re going to dive into:
- Top 10 CRM KPIs for sales executives to analyze
- 20 CRM KPI metrics for sales managers to track
- Best 8 CRM KPI examples for salespeople to watch
- How metrics indicate your CRM is working efficiently
We'll also share best practices on how to make sure you're not just getting all that data, but actually putting it to use to drive more revenue and help your team succeed. This isn't about theory or math—it's about a pragmatic approach to simplify the data to gain actionable insights.
Disclaimer: There are often multiple ways to calculate any given metric. In this post, we generally give you the easiest or most common way to do so, simply because that's good enough for most companies. However, it's ultimately up to you to figure out which method or formula is best for you, and paints the most accurate picture for your business. For example, we give you a simple formula to calculate churn, while you could adjust your calculation by factoring contract length, secondary orgs of the same customer, etc. We also link to a post that gives you a more in-depth breakdown of calculating churn in case you want to deep dive.
Psst...wondering what total contract value really means? Find out in our article!
Top 10 CRM KPIs for Sales Executives to Analyze
Sales executives are the higher-ups who make decisions that affect the sales team based on data that’s affecting the company and business goals. The best CRM KPIs for sales executives are the ones that give an overall view of the health of sales for their company.
LEARN HOW TO BUILD A SALES CRM ON YOUR OWN→
1. Renewal Rate
 |
For subscription sales and SaaS companies, the renewal rate is a way to see how happy your customers are with your product or service. This customer experience metric is very closely related to your retention rate.
Formula to calculate: Number of customers who renew ÷ number of customers who were up for renewal (x 100 to convert to a percentage)
Why you need to track it: This is a basic KPI that tells you the health of your process. If renewal rates go up or down, you'll then need to dig into the why.
While renewals can fall under the responsibility of sales or success teams, it’s essential for sales executives to understand renewal rates for their subscription-based business. If the numbers start to fall, execs can trace that back to the cause, and find new ways to handle customers who are coming up for renewal.
2. Average Sales Value
 |
The average amount of money spent per purchase.
Formula to calculate: Total sales value ÷ number of customers
Why you need to track it: Knowing how much you earn from each new sale is essential to help you forecast better and calculate other important KPIs.
While this baseline metric is essential for more accurate forecasts, it also helps set a precedent for how much should be earned per purchase. When execs work with sales teams to increase the average sales value, they’re actually helping reps to focus on getting more revenue with less effort.
Pro Tip: In Close’s Opportunity Funnels report, you can see the average value per win as an annualized figure, giving SaaS companies easy access to their average deal sizes.
 |
3. Monthly Recurring Revenue (MRR)
 |
For subscription-based businesses, MRR gives you a clear view of the general health of your business month-over-month.
Formula to calculate: Average revenue per customer X total number of customers that month
Why you need to track it: Get a clear view of how much money your business earns per month.
When making decisions about hiring new reps, promoting sales roles, or purchasing new software or tools, it’s important to know how much money is actually coming in. Sales executives whose businesses are run on subscriptions can use this metric to see how their decisions impact revenue month-to-month, or whether their current revenue justifies the investments they're considering.
4. Annually Recurring Revenue (ARR)
 |
Like MRR, ARR gives you an annual view of your business' health.
Formula to calculate: Average revenue per customer X total number of customers that year
Why you need to track it: Compare your business' success year-over-year.
The benefits of tracking ARR are the same as MRR, except this works for all types of business and gives you a more long-term view of the improvements being made and how well your customer retention efforts are working. As the sales team expands and adapts over time, watch how this metric changes year-over-year and see where your business is heading in the long term.
5. Net New Revenue Per Month
 |
See how much new revenue is coming in each month. For subscription-based businesses, this could also include upsells.
Formula to calculate: New customers that month X average deal size
Why you need to track it: See how much new revenue is coming in to get a clear view of your business' growth over time.
Tracking net-new each month gives you quick access to the data on what’s happening with your sales process as it happens. Watching this metric can tell you a lot about the seasonality of your sales process, or alert you to a flaw in the process before it becomes a major issue.
In Close, you can also see the exact dollar amount that you won during a certain period in the Activity Overview report.
6. Churn Rate
 |
The rate of churn in your customers per month or per year.
Formula to calculate: Number of churned customers ÷ total number of customers
Why you need to track it: Knowing what percentage of customers end up churning during the month helps you measure company growth, figure out which customers are most successful with your product, and forecast future growth more accurately.
This is an essential SaaS metric that sales executives must track to know how many customers are leaving each month and whether there’s a way to stop them before they decide to churn. Keep an eye on industry benchmarks to see whether your churn rate is higher than it should be.
Learn more about how to calculate churn rate.
7. Churn Rate by Reason for Churn
 |
The percentage of churned customers who left because of a particular reason.
Formula to calculate: Number of customers who churned for a particular reason ÷ total number of customers who churned
Why you need to track it: Knowing your churn rate is important, but understanding why customers churn can help you retain more customers in the future.
For sales executives, keeping track of the reason that customers churn can also give them clear information to share with other teams, such as customer support, success, or product. For example, if a major reason for recent churn is a new feature update that customers don’t like, sales executives can share this with the product team so they know how customers are reacting to the update.
Pro Tip: In Close, set up a Custom Field to track the reason behind churn or lost reasons.
 |
8. Customer Lifetime Value (CLV)
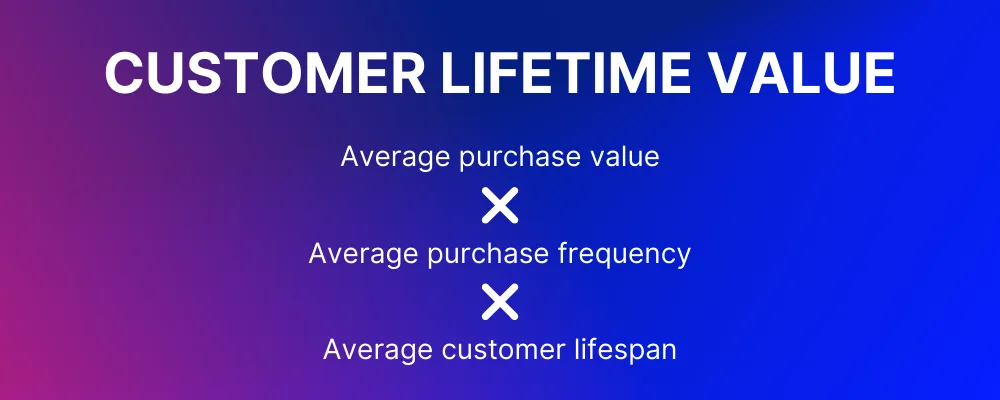 |
This tells you the total revenue you can expect from a single customer account during their lifecycle.
Formula to calculate: Average purchase value x average purchase frequency x average customer lifespan
Why you need to track it: When you know how much each customer is worth, you can try to improve that number by improving customer satisfaction, increasing upsells, and improving your renewal sales.
For sales execs, knowing CLV also helps you see the overall health of sales for a specific sector or product. For SaaS businesses, these metrics may show that your highest-quality customers are the ones that pay less but stick around longer. For eCommerce businesses, CLV can show you which products bring you the best customers, and help guide your business decisions in the future.
Comparing the average CLV to each new customer or different types of customers can also help you see which customers live up to the average, which ones go above, and which customers are less valuable than they should be. This can help execs point their teams to the type of customer that has a higher lifetime value and work smarter to bring in more valuable customers and qualified leads instead of a larger number of bad-fit customers.
Pro Tip: Wondering what your average purchase value is? Head to the Opportunity Funnel report in Close to see your average value per win.
If you're interested in taking a data-driven approach to measuring the value of your offerings, our post on value metrics can help you get started.
9. Customer Acquisition Cost (CAC)
 |
This is the average cost for your company to acquire new customers, including efforts from both sales and marketing teams.
Formula to calculate: (Cost of sales + cost of marketing) ÷ number of new customers acquired
Why you need to track it: Knowing how much it costs to acquire each new customer will help sales executives decide how much they can continue to invest in acquisition.
All sales executives know that one of the fastest ways to increase company revenue is to lower the cost of customer acquisition. With this key metric in mind, sales execs can make better decisions about the methods their team uses to generate new leads and gather more valuable customers, including marketing campaigns, social media ads, or outbound sales.
10. Net Promoter Score (NPS)
Net promoter score (NPS) is a measure of how likely a customer is to recommend your business to their network. This isn’t a metric to be calculated: it’s a question you ask your customers with a scale of 1 to 10.
Why you need to track it: While NPS isn’t the be-all-end-all of customer retention metrics, it does give you fast, valuable insights into how people feel about your product, and why they feel that way.
Customers who participate in an NPS survey are divided into three groups:
- Promoters (people who love your product and are very likely to recommend it)
- Passives (people who are mediocrely impressed with your product but probably won’t recommend it)
- Detractors (customers with clear negative feedback who may soon churn)
20 CRM KPI Metrics for Sales Managers to Track
Sales managers are working, not only to improve the sales process for their reps, but also to work with individual reps to up their skills and improve their close rates. That’s why the most important KPIs for sales managers are those that tell them about the success of different stages within the process as well as the specific activities of their reps.
Get a complete understanding of the "Benefits of a CRM" and how it can elevate your sales game.
11. Pipeline Stage Conversion Rate
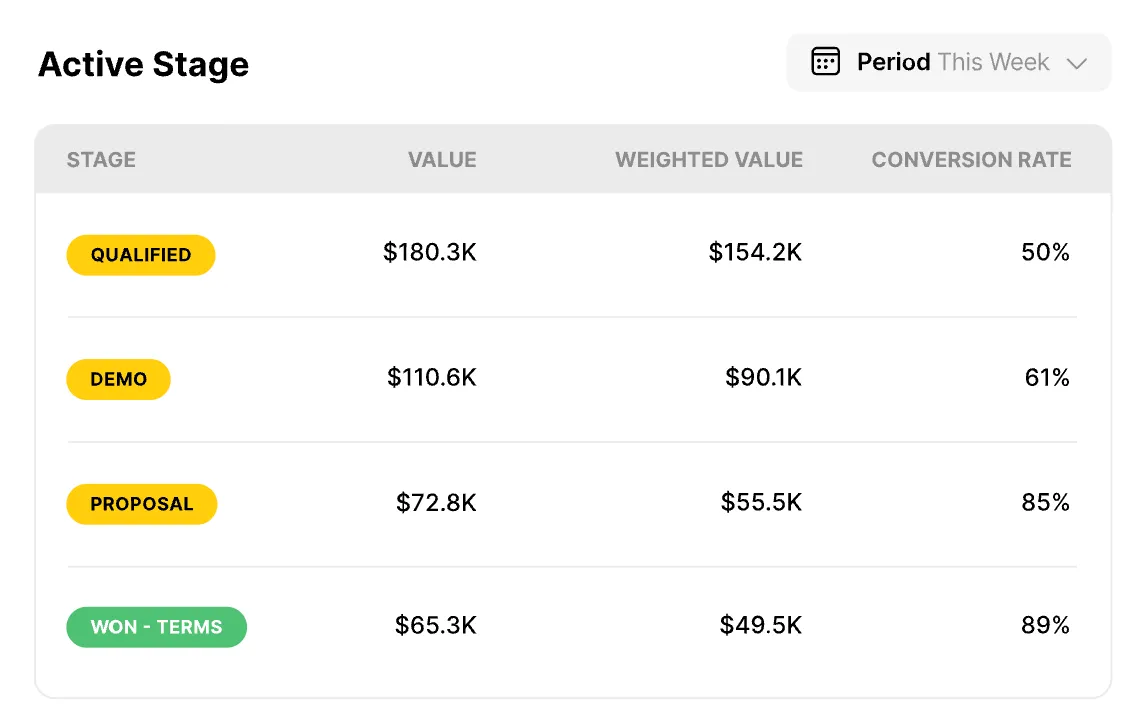 |
The percentage of opportunities in a certain stage that convert to the next stage.
Formula to calculate: Converted prospects ÷ total prospects in stage (x 100 to convert to a percentage)
Why you need to track it: This CRM KPI can help you identify bottlenecks in your sales pipeline and gives you better insights to smooth out the customer journey.
Your sales pipeline is a general overview of the process your reps are using to take people from ice-cold leads to happily converted customers. By checking the conversion rate for each stage, you can see how that process works in the real world, where prospects are getting stuck or falling out of the pipeline, and where improvements can be made in the different touchpoints within those stages.
Pro Tip: Many companies use a different sales process based on the type of sale. For example, if you sell to both enterprise and SMBs, your process (and your pipeline) differ greatly. Check your pipeline stage conversion rate using multiple pipelines in Close CRM.
12. Pipeline Stage Conversion Rate per Rep
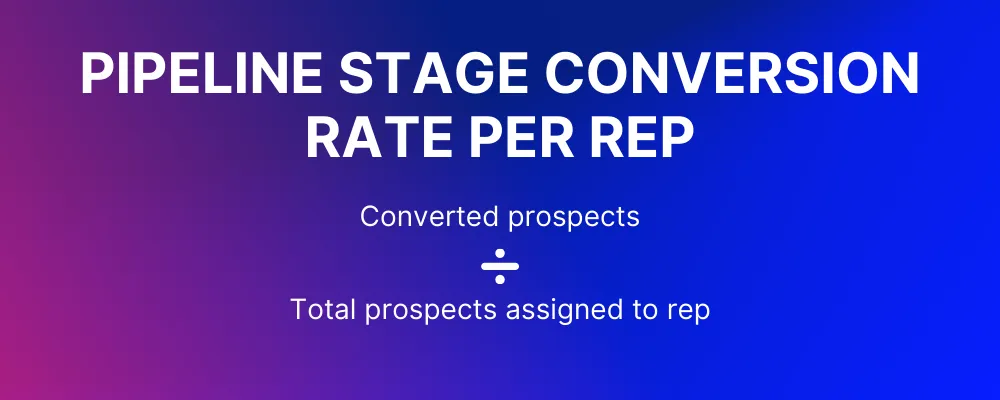 |
This tells you the percentage of prospects that convert based on the work of each rep.
Formula to calculate: Converted prospects ÷ total prospects assigned to a particular rep (x 100 to convert to a percentage)
Why you need to track it: Use this to determine the strengths and weaknesses of your reps in the pipeline. Compare this to the average conversion rate to see how each rep is performing at each stage of the sales pipeline.
Sales managers need to know where their reps succeed and where they need help. By tracking pipeline stage conversion rates for each individual rep, you’ll see if a certain rep keeps losing deals at a particular stage and coach them to improve their performance. Or, if you notice a certain rep getting higher conversion rates in a stage, learn more about the process they’re using and replicate that process on the rest of your team.
13. Average Time to Advance
The average time prospects spend in each stage of the pipeline.
Formula to calculate: Total time prospects spend in a stage ÷ number of prospects
Why you need to track it: Tracking this will help you see how long each stage takes to convert to the next, allowing you to see areas where you can optimize your process.
Each stage will obviously vary in length, but tracking that average length for each stage gives you a way to measure the success of new methods as you attempt to convert leads to the next stage faster.
14. Sales Cycle Length
 |
The average time it takes for a prospect to go from the start of the pipeline to closed-won.
Formula to calculate: Number of days from day created to day closed for all deals in a certain period ÷ number of deals won
Why you need to track it: Knowing your average sales cycle length is essential to track other important customer relationship management KPIs. Plus, tracking this over time tells you when your sales cycle is getting longer or shorter.
In business, time is money. The more time your sales team spends converting a customer, the lower your profit. Tracking the average length of your sales cycle will help you see how long it takes leads to convert, which gives you a baseline to improve on.
Most CRM reports will include this metric. You can also see this as the Average Time to Win in the Opportunity Funnels report in Close.
15. Sales Pipeline Velocity
This shows you how much money is passing through your sales pipeline every day, based on how fast leads are going through your sales pipeline.
Formula to calculate: Number of deals in pipeline x average deal size x average win rate ÷ average sales cycle length
Why you need to track it: This metric helps you understand how healthy your pipeline is and identify opportunities that are taking too long to close or areas of your workflow that need to improve.
Sales managers can work with reps to improve their methods and get more money to pass through the pipeline on a monthly basis.
16. Total New Leads Created
The number of new leads created during a certain time period.
Formula to calculate: CRM automation calculates this for you
Why you need to track it: This metric sets the foundation for other KPIs and helps you keep track of how different methods affect the number of new leads coming in.
Sales managers need to know the number of new leads coming in each month. Then, they can compare this number to the deals closed or the conversion rates to see if there are enough new leads coming in, or whether they need to find ways to bring in more valuable leads.
17. New Leads by Source
The number of new leads coming from each acquisition source.
Formula to calculate: Number of new leads separated by source (most CRMs will calculate this for you with integrations to your lead generation tools)
Why you need to track it: Separate your new lead list by source, and you'll see all the new leads you have depending on where they came from.
This KPI can help sales managers see which lead generation tactics bring more leads in for the sales team.
18. Total Opportunities Created
The number of new opportunities added to the pipeline in a certain period of time.
Why you need to track it: Use this metric to see how many opportunities get added each month and compare the numbers month-over-month to see the health of your sales process and team efforts.
Since new opportunities mean a deal is in the works, tracking how many opportunities are created compared to the total number of new leads in your CRM will help sales managers see whether their team’s outreach efforts are paying off, or if there is a need for improvement.
19. Total Lost Opportunities
The total number of opportunities lost during a given time period.
Why you need to track it: Tracking this metric will help you calculate other essential KPIs and gives you a baseline to see how many opportunities your team loses during a given period.
Knowing how many opportunities your team loses in a given month gives you a way to measure how new methods in the middle of the sales process are working, such as new ways to demo your product or an improved negotiation tactic.
20. Lost Opportunities by Stage
The number of opportunities lost from a certain stage in the pipeline.
Why you need to track it: Tracking lost opportunities per stage can help you see if there is an issue with your sales process.
Normally, lost opportunity rates should be higher at the beginning of the pipeline and gradually get lower as prospects move through the pipeline toward a sale. Sales managers who track lost opportunities by stage can see which stages are losing more opportunities and whether they can improve the methods reps are using at that stage to keep opportunities moving forward.
21. Lost Opportunities by Reason
The number of opportunities lost by the reason they were lost.
Why you need to track it: Separating your lost opportunities by the reason they were lost helps you see what the major obstacles to a sale are for your prospects. Then, you can work with your team to overcome these obstacles for future prospects.
To track this KPI in Close, create a Custom Field where reps can define the reason why an opportunity was lost. Then, in Explorer, you can create a graph that shows lost opportunities separated by the Custom Field you created. This will tell you the most common reasons you lose opportunities.
22. Sales by Acquisition Source
The number of closed deals by where they came from.
Why you need to track it: Knowing where your closed deals are coming from helps you see which lead generation methods generate more revenue.
This CRM KPI can give you clear patterns on the types of leads that are more valuable to your business. For example, do the great majority of your closed deals enter the pipeline from a form on your website? Then, maybe you can make that form more prominent, promote it online, or embed it directly into blog posts and landing pages.
23. Referral Rate
 |
The volume of referred purchases as a percentage of total purchases.
Formula to calculate: Number of referred purchases ÷ Number of total purchases
Why you need to track it: How many of your new leads are referred from other customers? Knowing this can help you improve your efforts to get more referral sales.
According to data from ReferralCandy, the global average referral rate is about 2.3% for those who are running a structured referral program with their customers. Keep track of your own referral rate to see if you can improve the number of referral sales you get from happy customers.
24. Total Emails, Calls, and SMS
 |
The total number of calls made and emails and SMS sent by sales reps during a period of time (day, week, month).
Why you need to track it: Knowing how much outreach your team is doing helps you correlate sales activity to other growth metrics, like closed deals.
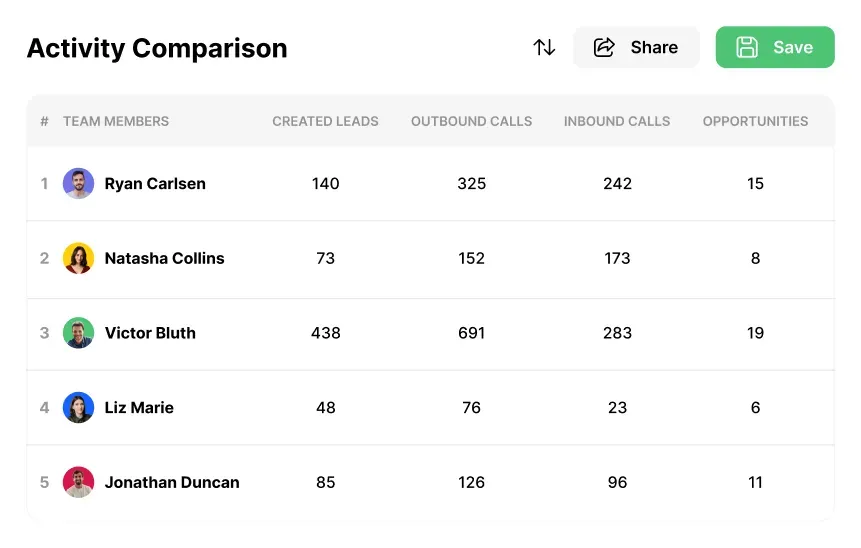
25. Calls, Emails, and SMS per Rep
The total number of calls made and emails and SMS sent by individual reps on your sales team.
Formula to calculate: Calculated automatically in your CRM
Why you need to track it: Compare team performance by calculating the amount of outreach each rep does. You can even filter it down further to the number of first cold calls made by each rep (vs follow-up calls with prospects who've already had an interaction).
For sales managers to successfully coach their teams, it’s essential for them to know what each individual rep is doing, and how their activity contributes to their success. The Activity Comparison Report in Close helps sales managers by giving them a spreadsheet-like view of all the activity of each rep and provides insight into this customer relationship management KPI. This report is easy to customize based on the CRM metrics that you want to see and gives sales managers the ability to correlate different types of activities to the success rates for each individual rep.
Pro Tip: Want to track your team’s individual activity? Sign up for a 14-day free trial of Close CRM and see how our adaptable reporting features allow you to see the data you need, the way you want to see it.
 |
26. Email and SMS Response Rate
The rate of response from prospects.
Formula to calculate: Responses ÷ delivered emails (Most CRMs will calculate this for you)
Why you need to track it: This average is a baseline you can use to see what kind of response your team gets to their emails and SMS. By tracking this baseline, you can compare different templates and styles to see what performs better.
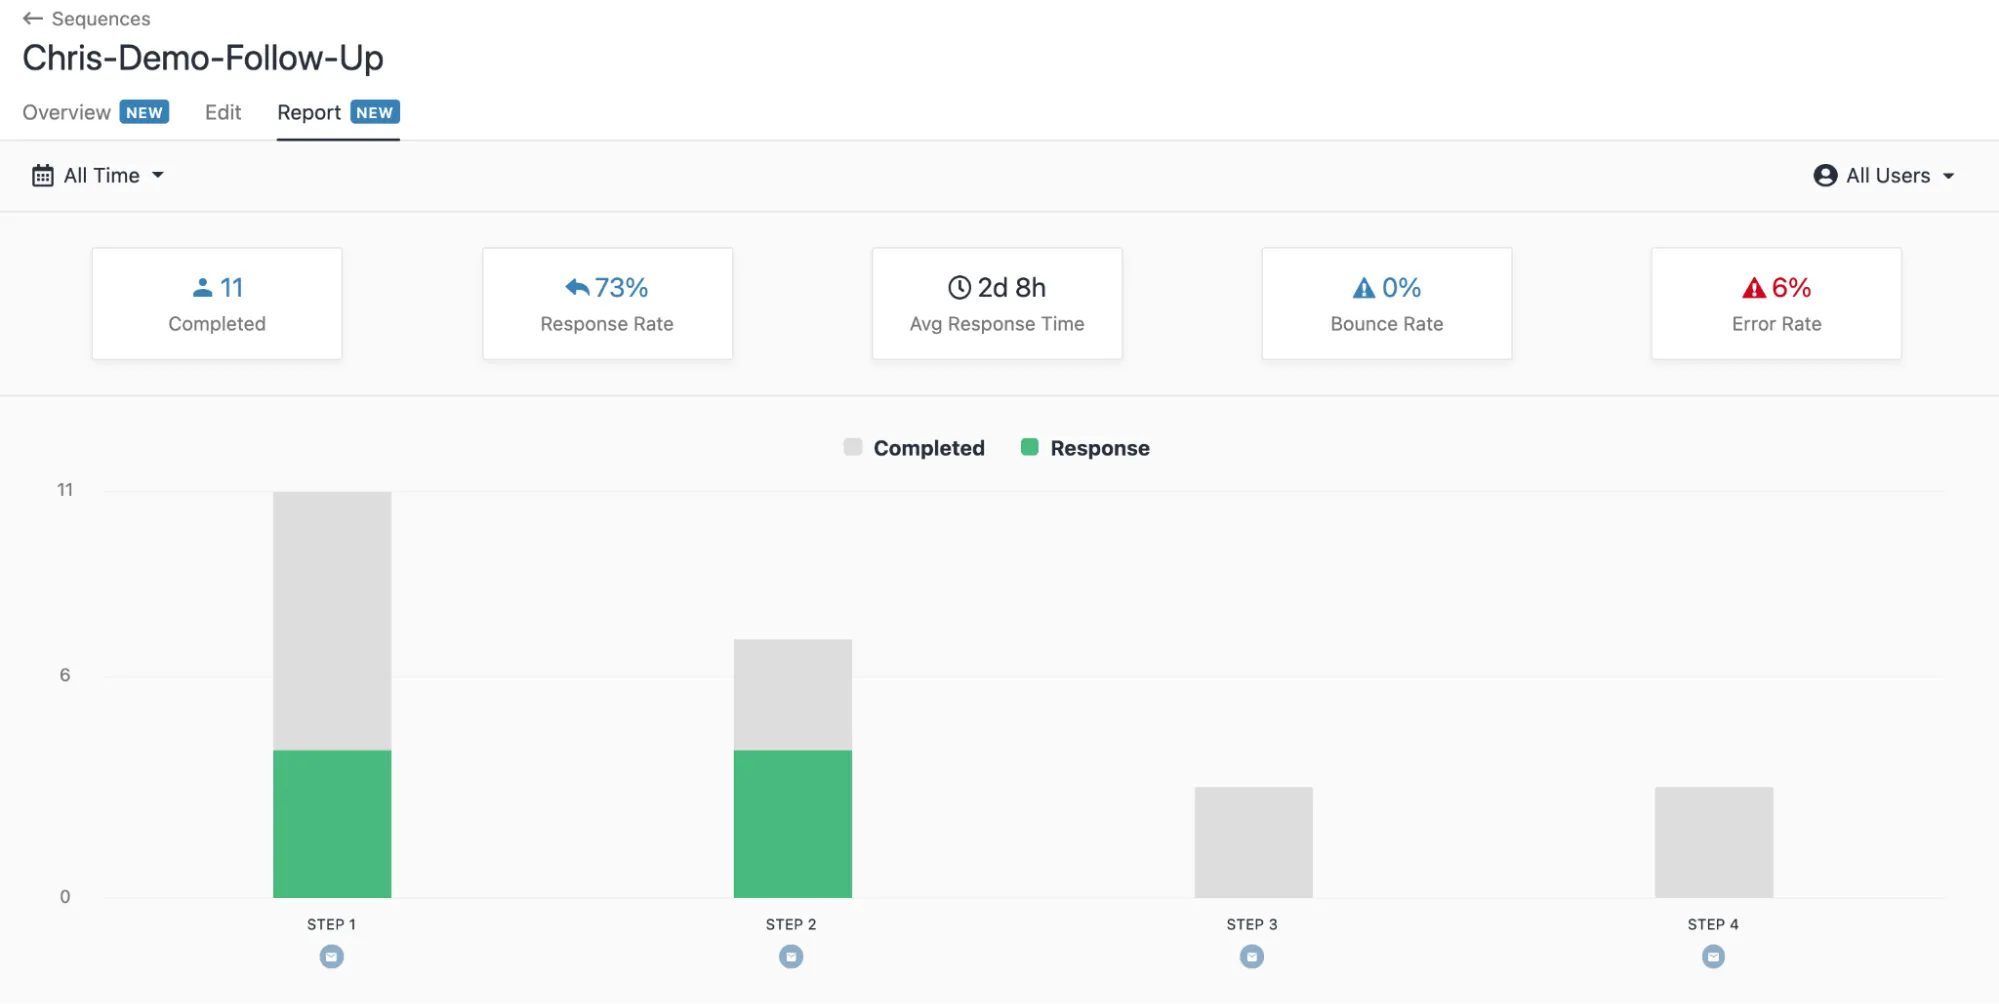
For sales managers to see how their team’s emails are working, it’s essential to know the response rate. In Close, we’ve made this visible in two ways: first, you can use the Sent Email Report to get a clear view of the open rate and response rates for emails.
Or, if you’re checking response rates for email sequences, you can head to the Sequences tab and see response rates per sequence, or per step in the sequence.
 |
27. Email and SMS Response Rate per Rep
The rate of response from prospects.
Formula to calculate: Responses ÷ delivered emails per rep
Why you need to track it: Compare this KPI to the baseline average and see which reps are performing better or worse. Then, take those insights and find out why.
In the Sent Email Report in Close, mentioned above, sales managers can see response rates for the whole team or for individual reps. By separating rep response rates, managers can see who might need more coaching on sending sales emails, or who is excelling at this method.
28. Average Call Duration
How much time your sales team spends talking to prospects.
Formula to calculate: Total time spent on the phone ÷ number of calls
Why you need to track it: This CRM KPI sets a baseline to help you calculate other metrics related to calling. For example, when the team talks less, do sales go up or down?
By keeping track of the average time your reps spend on the phone with prospects, you can see how well they’re spending their time and whether the time they spend on the phone pays off.
29. Average Call Time per Rep
The average time your reps spend on the phone with each prospect.
Formula to calculate: Time spent by an individual rep on the phone ÷ number of calls that rep made
Why you need to track it: Compare the time each individual rep spends on the phone to their success rates.
When sales managers watch this metric, they can see how each individual rep succeeds with their phone methods. Do reps spend too long on the phone and lose the interest of their leads? Or do longer calls correlate to better success rates?
30. Upsell Rate
 |
The number of customers who increased their spending with your company in a given period of time.
Formula to calculate: Number of customers that purchased more (or upgraded their plan) ÷ total number of customers
Why you need to track it: Upsell rates help you get a clearer view of your baseline, as well as showing you where you can improve in your upsell tactics.
For sales managers looking to help their team increase revenue quickly, improving upsells is a great place to start. Tracking upsell rates gives managers a place to start, but it also helps them track the success of their upsells by comparing other metrics. For example, if upsell rates increase but churn also starts to go up, reps may be trying to upsell customers to a higher plan that they don’t really need.
Pro Tip: Sales managers should be comparing rep activity, as this is a great way to identify top performers and generate healthy competition in a team. That’s why sales managers love Close’s customizable Leaderboard, as it allows them to choose KPIs to track and compare for their sales team. Leaderboards rank sales reps based on the CRM metrics you choose, such as created leads, emails sent, calls made, call duration, deals closed, and more!
Watch our free, on-demand demo to see how Close can boost your team’s productivity.
 |
Best 8 CRM KPI Examples for Salespeople to Watch
Each individual salesperson should keep track of KPIs that help them improve their own sales tactics. Using their CRM, reps can track KPIs against the baseline set by the rest of the team, and work to improve their performance in healthy competition with the rest of the team.
31. Sales Cycle Length
How long it takes from the time a lead enters the pipeline to the time the deal is closed.
Formula to calculate: Number of days from day created to day closed for all deals in a certain period ÷ number of deals won
Why you need to track it: Sales reps should track their sales cycle length to test the results of new skills or methods.
While it’s true that sales managers track sales cycle length for the team, each individual rep can check their own sales cycle length and compare it to that average. That way, you can see whether your deals are taking too long to close and identify ways to shorten the sales cycle.
32. Total Calls, Emails, and SMS
The total number of outreach during a certain period of time.
Why you need to track it: Tracking your individual outreach metrics helps you improve your effort-to-success ratio.
Reps need to have a handle on the outreach they’re doing every month. Then, you can track how certain methods convert over time and compare each month to see improvements based on the number of calls made, or emails and SMS sent.
33. Email and SMS Response Rate
The number of responses received from prospects in your pipeline.
Formula to calculate: (Responses ÷ delivered emails) x 100
Why you need to track it: By tracking response rates for your emails, you can test different methods and templates to see what works best for your audience.
Which cold email templates get more responses or more unsubscribes? What time of day should you be sending emails? Sales reps can check the average response rate for all of their emails, then compare different campaigns or templates to see if response rates go up or down. Tracking this KPI can help you improve your cold email response rates.
If you’re sending cold emails in Workflows in Close, you’ll be able to see response rates quickly from the Report tab under each sequence you create.
Say goodbye to writer's block with our cold email generator - an AI tool that makes it easy to create compelling email templates for your outreach campaigns.
34. Average Call Time
How much time you spend talking to prospects.
Formula to calculate: Total time spent on the phone ÷ number of calls
Why you need to track it: This KPI sets a baseline to help sales reps calculate other metrics related to calling.
When you know how long you’re spending on the phone, you can answer questions and improve your skills with calling. For example, when you talk less on the phone, do your conversion rates go up or down? Does the reaction depend on where the prospect is in the sales pipeline?
35. Call Reach Rate
 |
How often you connect with a prospect when making calls.
Formula to calculate: Number of connections ÷ number of calls made
Why you need to track it: Knowing your baseline call reach rate can help you test making calls at different times.
Knowing when to reach your prospects is a challenge for all sales reps. By keeping track of this metric, you can test to see when your reach rate is better. See if you can improve your reach rate by changing your sales call timing.
36. Close Rate
The number of deals that close in comparison to the opportunities that are on the table.
Formula to calculate: Closed-won deals ÷ total deals
Why you need to track it: This baseline metric gives you an average to shoot for.
Knowing your average close rate is essential for all salespeople. Not only does this metric keep you informed of how sharp your sales skills are, but it also helps you test to improve your methods and sales strategies. When testing different sales methods, outreach tactics, or sales pitches, you can compare the close rate to your average and see if you can improve it.
37. Relationship Freshness
The number of days since your last contact with a prospect or customer.
Why you need to track it: This KPI tells you how fresh your relationship with customers and prospects is, and helps you avoid letting these people fall through the cracks.
While juggling so many different leads and opportunities, it can be easy to forget about someone. That’s why tracking this KPI in your CRM is essential. For example, in Close, you can take the list of leads assigned to you and sort them by the last time you contacted them. Then, you can see which relationships you need to rekindle, and which ones are nice and fresh.
8. Follow-up Conversion Rate
 |
The percentage of prospects who convert based on your follow-ups.
Formula to calculate: Number of conversions ÷ number of follow-ups sent or made
Why you need to track it: Tracking how your follow-up calls and emails convert will help you see which methods work better.
If you want to dig a little deeper, separate follow-up conversion rates by the type of follow-up you’re conducting. For example, how many conversions do you get when following up on a prospect who told you to get back in contact down the road? Can you improve that particular conversion rate?
How Metrics Indicate Your CRM is Working Efficiently
Now that each member of your sales team knows what they need to be tracking, what do these metrics tell you about your CRM and your sales process?
CRMs are Working When…
- Activity metrics are improving month-over-month: When sales managers see activity metrics going up over time, that means their reps are achieving more in the workday and productivity is increasing
- Bottlenecks in your sales process are easy to identify: By tracking CRM KPIs effectively, you can have a clear view of your pipeline and know exactly where improvements need to be made the moment a problem appears
- Sales cycle length and pipeline velocity are improving: When you see these CRM metrics improving, it means your team is working smarter and closing deals faster
- Managers can use real data to personalize individual coaching sessions: The right CRM KPIs tell managers exactly what each rep needs, so you can go into coaching sessions with the information you need to have a productive outcome
- Your sales team engages in healthy competition: With activity and deal data readily available to the whole team, a properly functioning CRM will encourage healthy competition that pushes each member to perform better (Especially when your CRM includes a built-in team leaderboard!)
You’ve Got a Problem With Your CRM When…
- Opportunities are getting lost but you don’t know why: If you can’t identify key reasons why opportunities are lost, you need to improve the level of data recorded in your CRM
- Deals are falling through late in the sales cycle: Losing a large number of opportunities towards the end of the cycle is normally a sign that something is broken or missing in your process
- Managers can’t pinpoint why low performers aren’t as successful: If your CRM doesn’t allow you to properly track activity data, sales managers can’t identify the key behaviors and activities that make or break sales for their team
- Sales forecasts aren’t accurate: If your sales forecasts are repeatedly coming up short, you probably have an issue with the KPIs in your CRM
Pull These Essential KPIs From Your CRM Metrics and Work Towards Success
Whether you want to close more deals, generate more leads, or simply increase revenue, tracking CRM KPIs is vital.
But knowing your KPIs is just the start: After tracking the data, you need to take action to improve those metrics.
How easy is it to share your metrics with team members? With Close’s easy reporting views, the whole team has access to the data around Opportunity Funnel conversions, Activity Overview, Activity Comparison between reps, and more.
Remember that more data doesn’t necessarily translate into more revenue. So, instead of trying to track everything, choose the KPIs that have the most impact on your business, team, and sales process, and work to improve those metrics.
Then you’ll be setting up a process for success.
Looking to assess your company's profitability? Discover how the return on sales ratio can be a valuable tool in my informative article.
Psst... Ready to try the CRM that gives you all the right KPIs, without the hassle? Take Close for a spin for 14 days, no cost.