
Close is different.
CRM built for salespeople, by salespeople.

Fast setup
Close takes just minutes to fire up. And rep onboarding? Give us a few hours––not weeks.
Simple, but flexible
With Custom Activities, Custom Fields, and Custom Objects, you can customize Close to work for you.
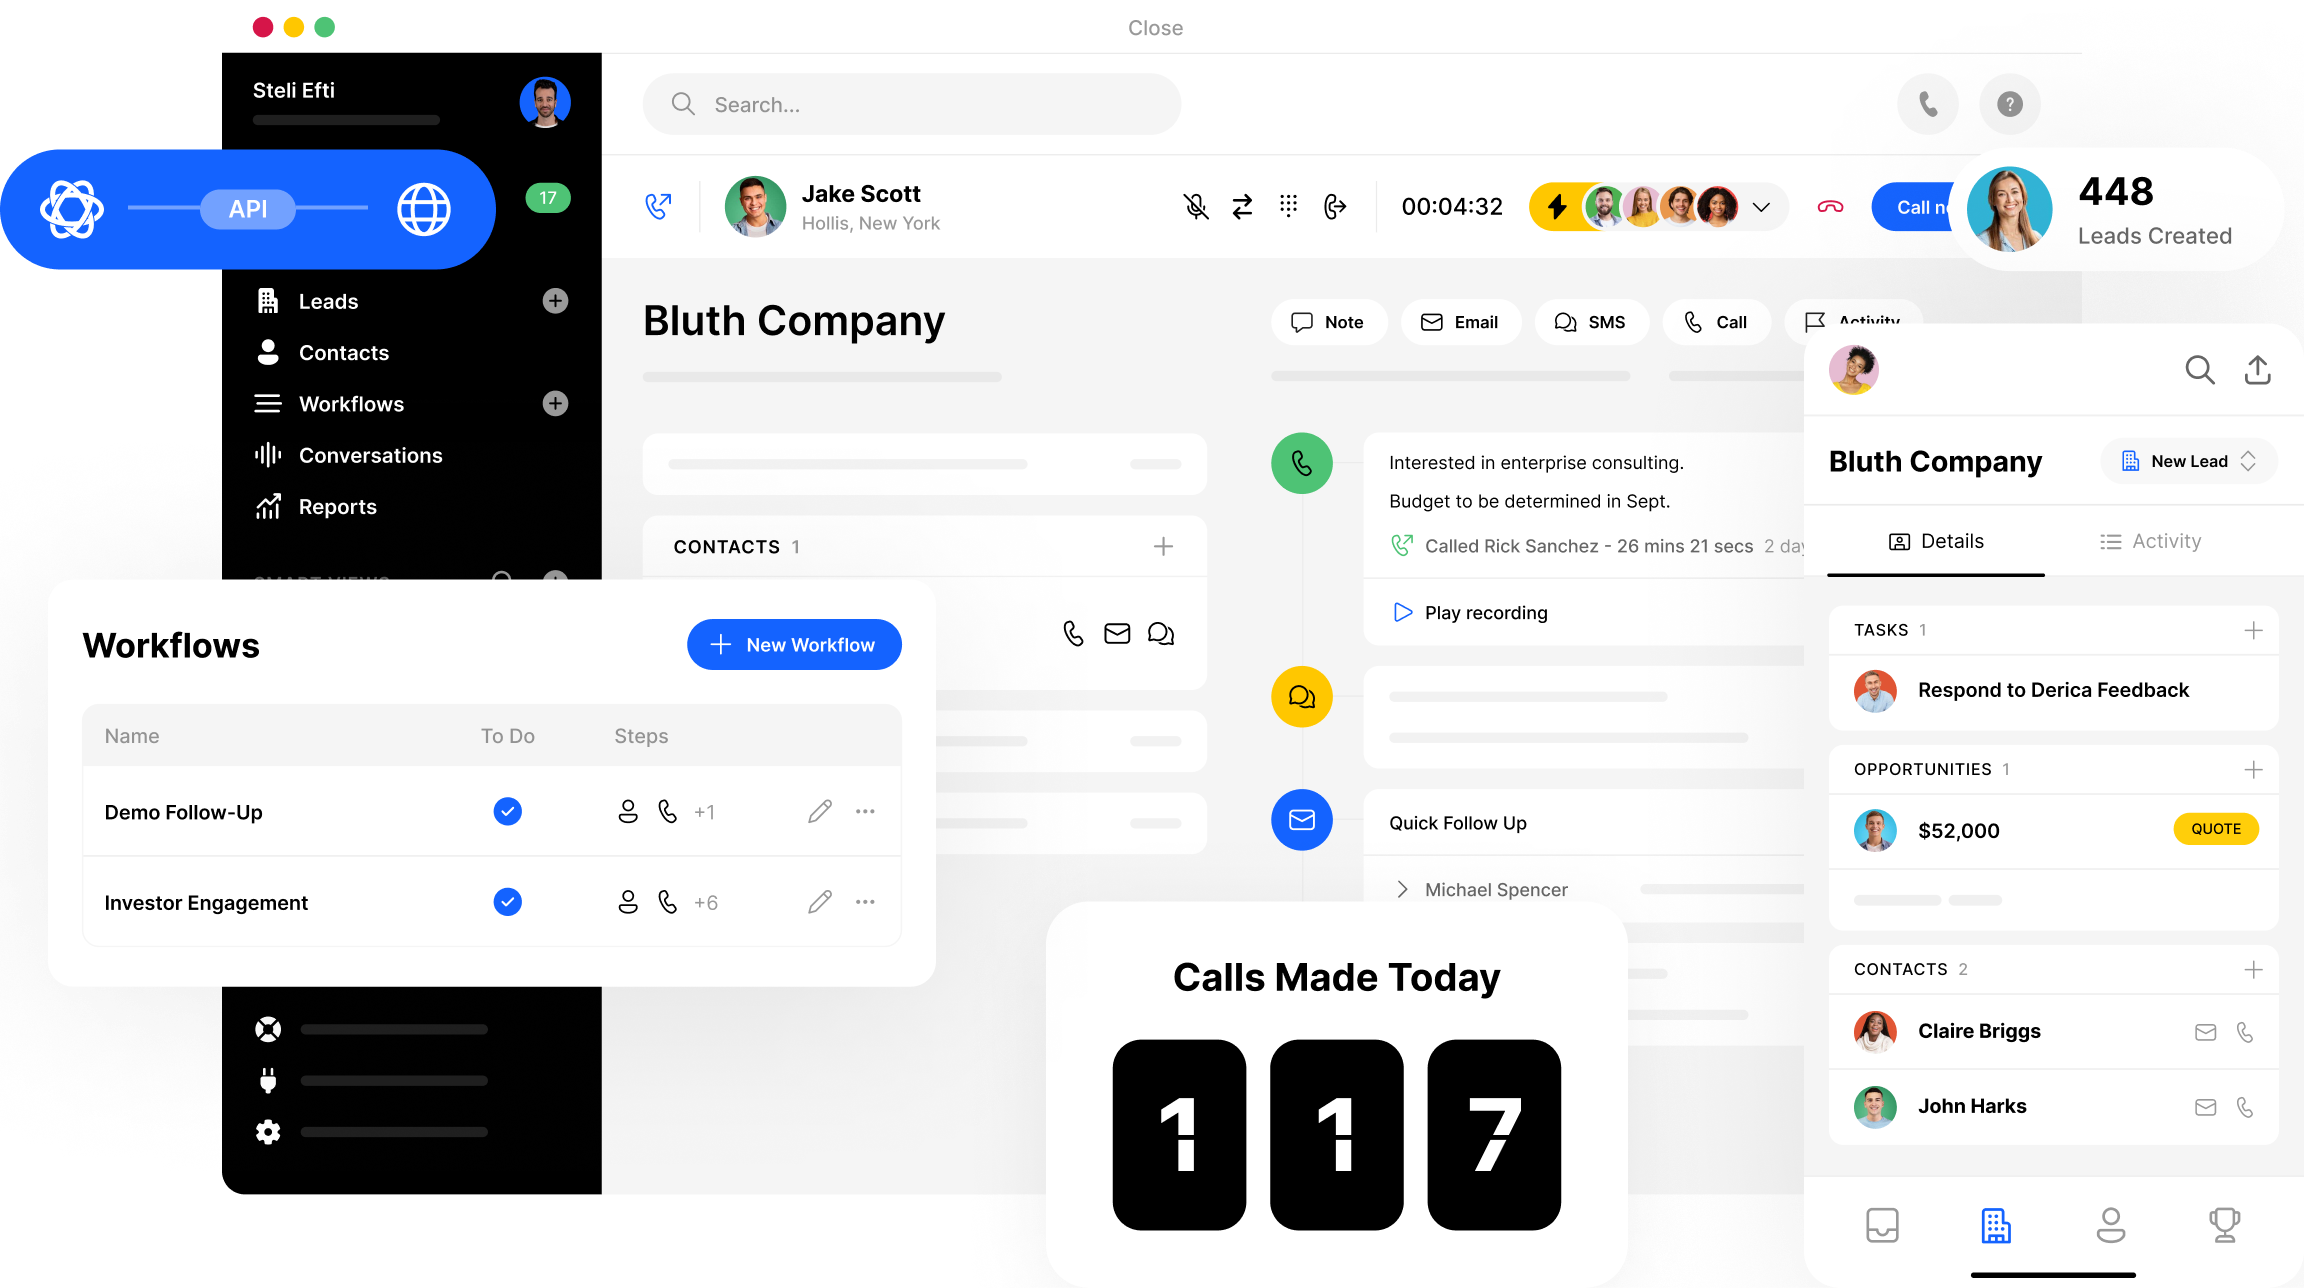
All-in-one selling
Calling, SMS, Zoom, and email + calendar integrations. It’s all included—no additional apps required. Use Close on mobile and desktop apps.
Secure
Use our roles and permissions with lead visibility to ensure your team members view only the info they need. Close is also SOC 2 Type 2 compliant and GDPR + CCPA compliant.
Communication
Email + calendar sync
Sync your work email and calendar with Close so you can operate all day in one place: the Close Inbox. Plus, centralize context for your team, syncing communications on each Lead’s timeline. All your info in one spot—no need to switch apps.
Calling + SMS
Close offers best-in-class customizable call software for outbound sales reps. Get built-in VoIP and SMS, plus automation features like Call Assistant, Power Dialer, Predictive Dialer, and Call Coaching to speed through your outreach with ease.
Tasks + your team
Set Tasks for yourself and other team members within leads. Note unique actions that aren’t in your normal workflow, or seek help from a team member to share an update, provide support, and more.
More communication featuresAutomation

Workflows
Employ email, call, task, and SMS automation via automatically or manually triggered Workflows. Once you find a Workflow cadence that works, save it as a template and share with your team in one click.
Search + Smart Views
Search and Smart Views help to prioritize the leads that matter to you right now. Engage Power Dialer and Predictive Dialer to automate and expedite calling outreach.
More about automationCall Assistant
Never take notes again with Close’s built-in Call Assistant. Automatically transcribe and summarize every phone call––so your reps can be more focused and productive than ever. Each transcription produces an accurate, searchable summary with action items.
More about Call AssistantReporting

Sales funnel reporting
Gauge Pipeline health and fix leaks with the Sales Funnel Report, available on all plans.
Customizable fields + activities
Shape Close to fit your unique sales workflow with flexible fields. Organize and report the most important prospect details, right in your CRM.
Leaderboards + User comparisons
Draw on Leaderboards and User comparisons to train and track the skill development of your reps.
More reporting featuresIntegrations
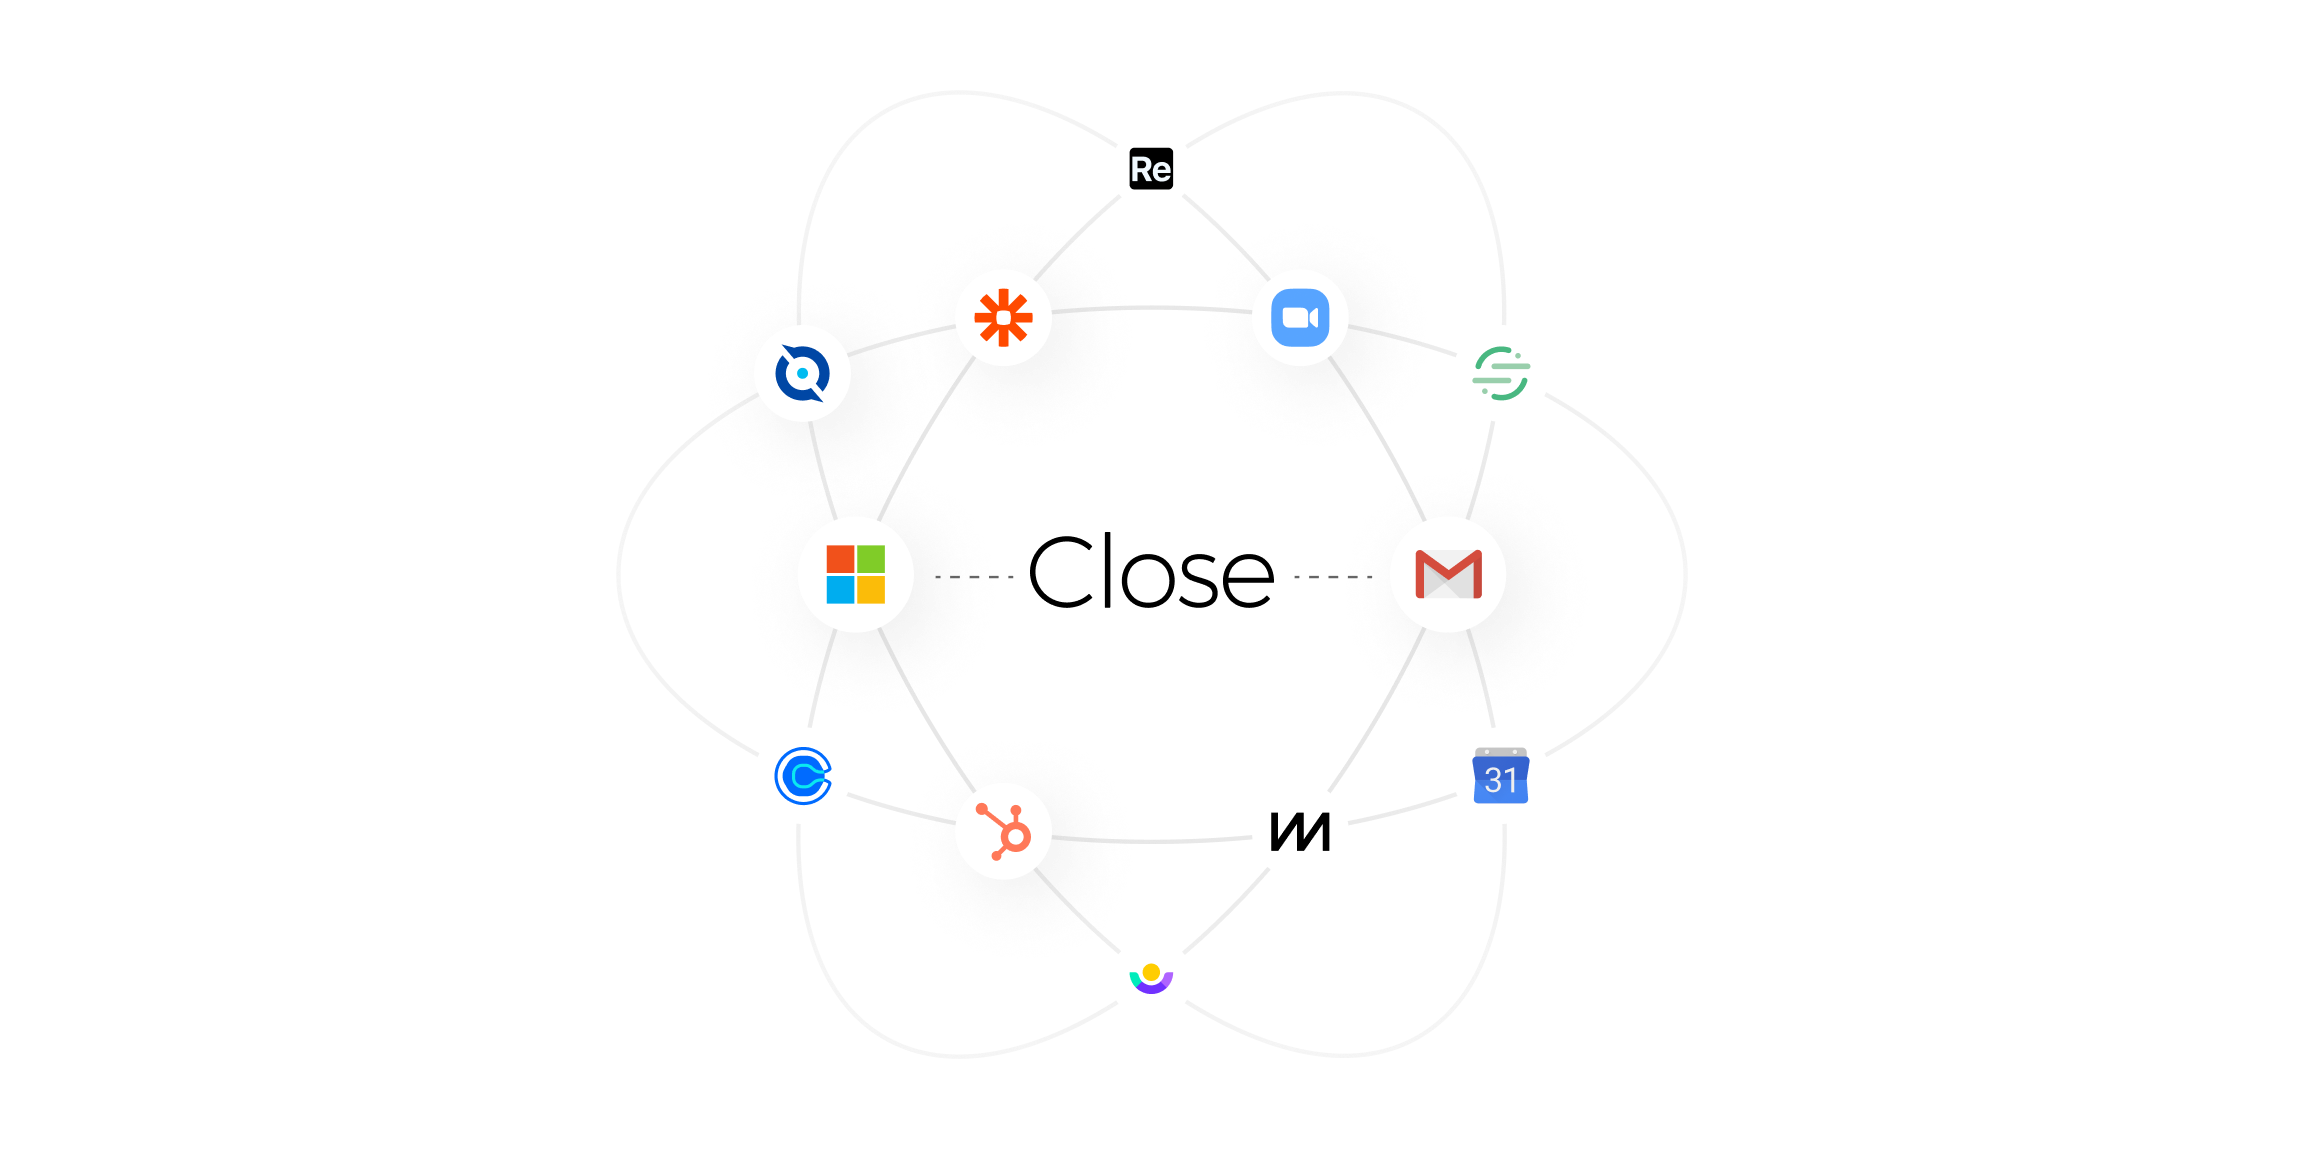
Sync Close with your tech stack via 100+ native, no code, and Zapier integrations.
Plus, get more context on your leads with an Integration Link. Jump to other websites and tools, securely passing data from your Leads, Contacts, and Opportunities. All in one click.
Trusted by the worlds fastest growing teams


On-demand demo
Learn the how + why of Close in 10 minutes.

Talk to a real human
Get the gist of Close with a guided, B.S.-free tour.